How to plot points in 3D with Graphing Software?
Posted on April 15, 2014 at 11:40pm by Dr. Saeid Nourian
 If you need to plot points in 3D easily and quickly you probably don't
want to wrestle with the complexity of MatLab. Even Microsoft Excel has
found a way to turn this simple task into a tedious one.
If you need to plot points in 3D easily and quickly you probably don't
want to wrestle with the complexity of MatLab. Even Microsoft Excel has
found a way to turn this simple task into a tedious one.
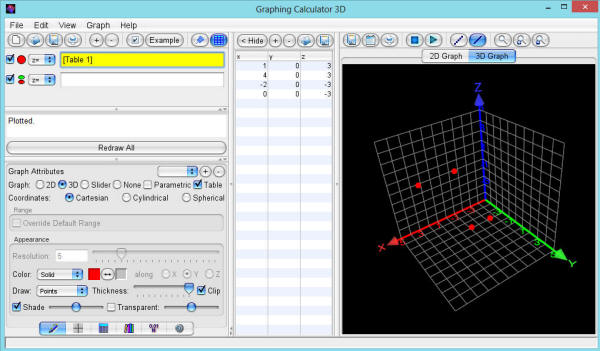
Luckily there is a free software called Graphing Calculator 3D that allows you to plot points by simply typing them down in a table of values. The resulting graphs are nicer than what MatLab could ever produce.
To plot points type down the 3D coordinates in the x, y, z table as shown below. After each coordinate is typed the resulting graph will be updated immediately.
The appearance of the graphs are highly customizable. By default the points are drawn at a 3 pixels width. You can use the "Thickness" slider to increase the size of the points to as thick as 10 pixels as shown in the screenshot below. I personally find the axis grid colors distracting when plotting points so I usually disable them by switching to "Axis Attributes" panel and clicking on "Appear" tab in order to turn off the "Color Tick Grids" option. Other attributes such as axis range, axis center, number of ticks, axis color, grid color and background color can also be changed.
If you already have a set of points in an Excel sheet and want to plot them then all you need to do is to save the Excel sheet as a *.csv (Comma Separated Vector) file and then import it in Graphing Calculator 3D. To import your *.csv file click on the "Import Coordinates" icon which is the blue open button on the toolbar located directly above the x, y, z table.
Make sure that your Excel sheet only contains numbers. The software assumes that the first column is X, the second column is Y and so on.
You can download Graphing Calculator 3D from here. The free edition of Graphing Calculator 3D is capable of plotting 3D points without limitations but importing *.csv can only be done in the paid version.
