Graphing Calculator 3D Inequality
Inequality Equations
The area a curve or the volume under a surface can be nicely rendered using semi-transparent colors that clearly demonstrate the extent of the area. This feature is especially powerful in 3D when the graph can be rotated in real-time to view the volume under a surface from all angles.
In addition to cartesian coordinates you can also generate the volume under the surface for polar, cylindrical and spherical equations.
Examples
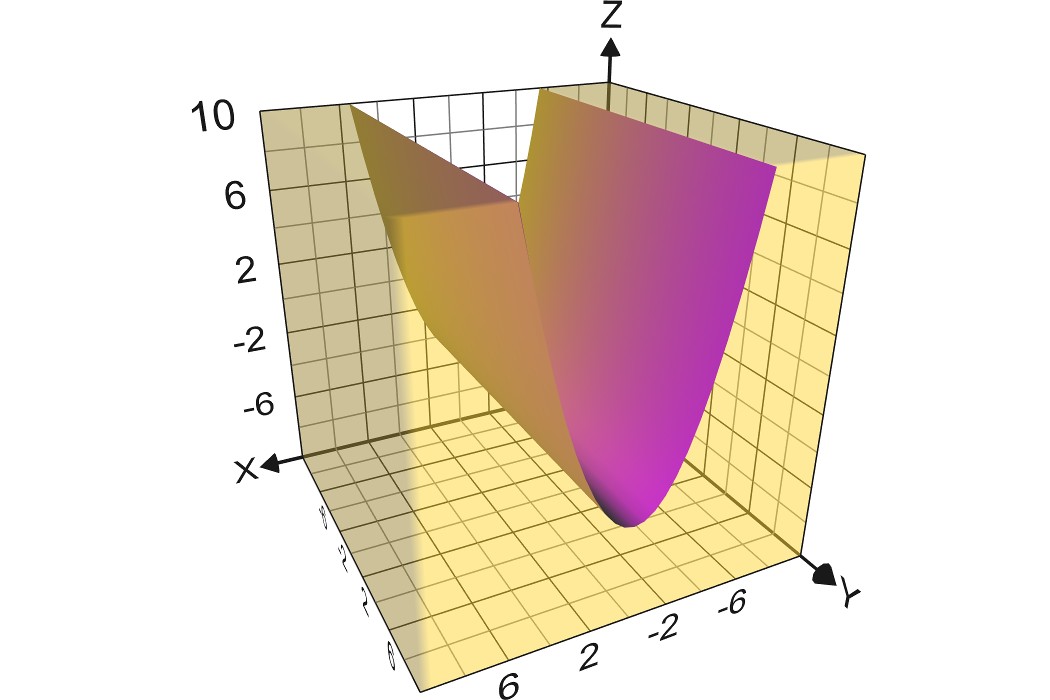
- Cartesian equations:
- z < sin(x)+sin(y)
- y < sqrt(z-x^2)
- x > y^2
- Spherical equations:
- r < sin(θ+φ)^r
- θ > φ+r