3D Graphing Calculator
Posted on Aug 11, 2014 by Dr. Saeid Nourian
 Although there are many online and offline graphing calculators
available today only few are capable of plotting 3D graphs. Of those,
most are either too complex to use or too primitive to be useful.
Luckily
there is a 3D graphing software that hits a right balance
between ease of use and complexity.
Plot 3D Cartesian Graphs
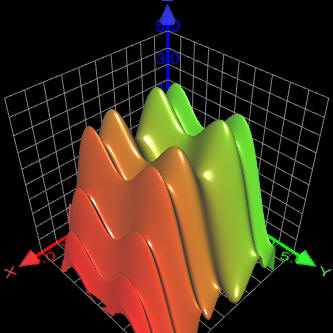
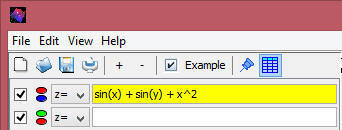
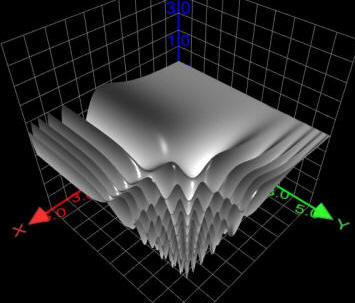
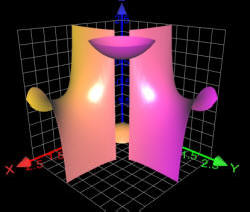
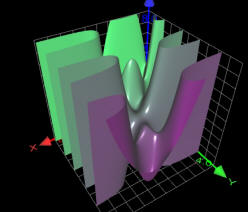
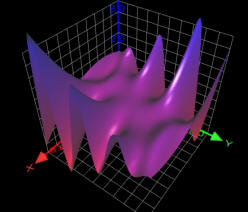
To plot a function that starts with z= simply type it down in the space provided. After each keystroke the software updates the graph view. The generated 3D graphs are beautifully rendered and shaded with colors.
Plot 3D Polar Functions
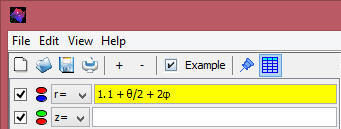
Switch to polar by selecting either Spherical or Cylindrical coordinates. Polar functions start with r= and you can use Ctrl+1 and Ctrl+2 to insert delta and phi characters.
Plot 3D Parametric Functions
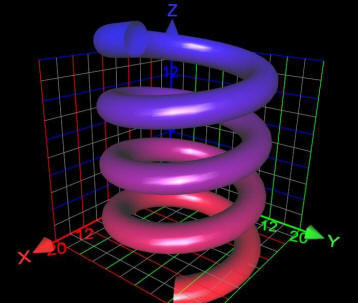
Select parametric option and then type functions that include u and v variables. You can customize the range of u and v in Draw Attributes. As soon as all 3 formulas are typed in properly in front of x= and y= and z= the 3D graph that corresponds to the parametric equation is plotted.
Download 3D Graphing Calculator
Download the free version of 3D Graphing Calculator and start plotting your own 3D graphs now. It's available for both Windows and Mac computers.