Plot 3D Contour Graphs
Posted on Dec 3, 2014 by Dr. Saeid Nourian
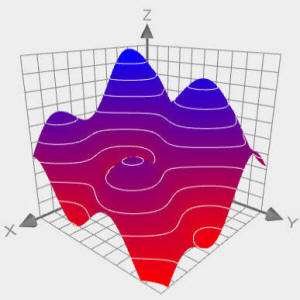
 Contour graphs are very useful in 3D because they make it easier
to visualize and compare the z-elevation of the graphs at various
regions. The new version of Graphing Calculator 3D makes it incredibly
easy to add contour lines to your 3D graphs.
For those who are not familiar with it, Graphing Calculator 3D is a powerful math graphing software that can generate high quality 3D graphs. Unlike Matlab and Mathematica, this software has an easy-to-use intuitive user interface that does not require scripting.
3D contour graphs of explicit functions
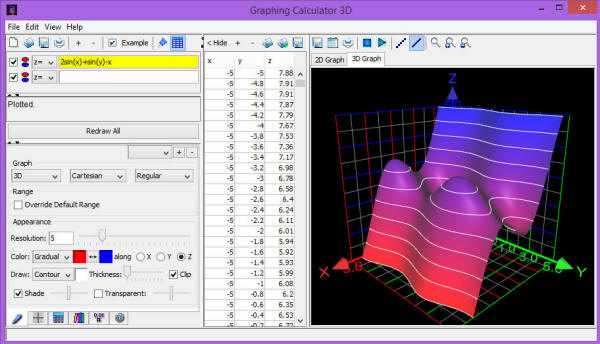
To plot the 3D contour graph of z=2sin(x)+sin(y)-x simply type it down as shown below, then add the contour lines by selecting "Contour" from the draw-style options.
You can adjust the thickness of the contour lines via the thickness slider. You can also change the color of the contour lines by clicking on the white box in front of it.

3D contour graphs of implicit equations
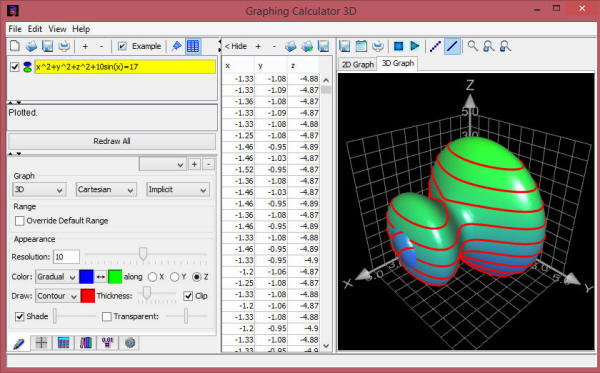
Plotting contour graphs of implicit equations follows the same steps as above. First plot your desired implicit equation by selecting "Implicit" from the equation-type options and typing your implicit equation. Then select "Contour" as draw-style.

 Change frequency of contour lines
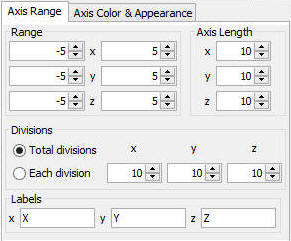
You can control the number of plotted contour lines along z-axis by modifying the axis settings. The software will always plot one contour line per z-division, so by increasing and decreasing the number of z-axis divisions you can control the number of visible contour lines.
Download 3D contour grapher
You can download 3d contour grapher and try the above examples in it.