Plot CSV Imported Points in 2D & 3D
Posted on July 10, 2014 by Dr. Saeid Nourian
 Plotting points from csv files should be a simple task but there are
very few programs out there that can do it well. Most available programs
are either too limiting or too complex to use. Graphing Calculator 3D
falls in a perfect middle where it's both capable and easy to use.
Plotting points from csv files should be a simple task but there are
very few programs out there that can do it well. Most available programs
are either too limiting or too complex to use. Graphing Calculator 3D
falls in a perfect middle where it's both capable and easy to use.
There are two kinds of csv files that you may want to import:
- Those that have one coordinate per row;
- Those that have one coordinate per grid.
Graphing Calculator 3D supports both of them.
Rows of Coordinates
Your csv file may contain one or more rows, each representing a single coordinate point. Depending on how many columns your file has and which Draw Attribute settings you selected in Graphing Calculator, these rows of coordinates may translate to:
- (x,y)
- (θ,r)
- (x,y,z)
- (θ,φ,r)
- (θ,z,r)
If you need to have more control over which columns should represent which coordinate values then make sure that you csv file has a header row with the following possible headers for each column:
- x
- y
- z
- theta
- phi
- height
- r
Plot Cartesian Points in 2D or 3D
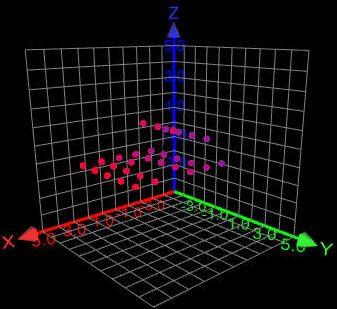
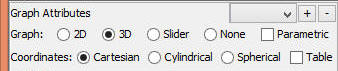
First ensure that under Draw Attribute you select "Cartesian" as coordinates. In addition, if you intend to plot 3D cartesian coordinates select "3D" as graph type, otherwise select 2D.
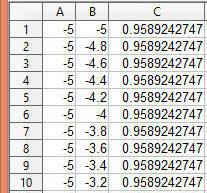 Then you need a
csv file that has 3 columns of numbers that represent (x,y,z)
coordinates (shown on right), or 2 columns that represent (x,y)
coordinates.
Then you need a
csv file that has 3 columns of numbers that represent (x,y,z)
coordinates (shown on right), or 2 columns that represent (x,y)
coordinates.
When ready, import the csv file by clicking on the open button on the toolbar directly above the table of values. (Note: Do not confuse the import open button with the main file open icon that is located directly above the equations).
The points will be plotted for you as soon as you import them. In 3D mode, you can rotate the graph with your mouse to look at the cluster of 3D points from any angle you wish.
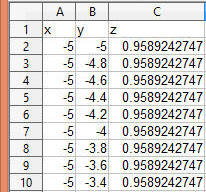
If a header row is missing the program assumes that the first column is x, second column is y, and so on. To have more control over that add a header row (first row) that clearly indicate which columns are x, y or z as shown here:
 Plot
Polar Points
Plot
Polar Points
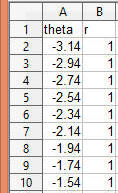
Select "2D" graph and "Polar" coordinates. Then import a csv file that has two columns that represent (θ,r).
If you want to tell the program which column represent which data then add a header row with theta and r values as shown on the right.
Plot Cylindrical coordinates points
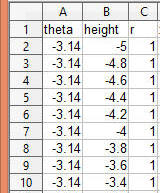
Select "3D" graph and "Cylindrical" coordinates. Then import a csv file that has three columns that represent (θ,z,r).
If you want to tell the program which column represent which data then add a header row with theta, height and r values as shown here:
Plot Spherical coordinates points
Select "3D" graph and "Spherical" coordinates. Then import a csv file that has three columns that represent (θ,φ,r).
If you want to tell the program which column represent which data then add a header row with theta, phi and r values similar to cylindrical example.
Extract Coordinates From Table Grids
 The
above examples shows csv files that have a single coordinate per row.
But it is also possible to import csv files that have a single
coordinate per grid. The program can automatically extract the z value
from the grids and assume that the x value is the value shown in the
first column and the y value is the value shown in the first (header)
row.
The
above examples shows csv files that have a single coordinate per row.
But it is also possible to import csv files that have a single
coordinate per grid. The program can automatically extract the z value
from the grids and assume that the x value is the value shown in the
first column and the y value is the value shown in the first (header)
row.
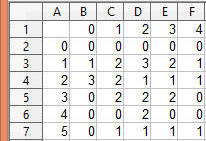
In the above example column A are the x values and row 1 are the y values. From cell B2 the program extracts (0,0,0) coordinate. From cell D3 the program extracts (1,2,3) coordinate and so on:
- (0,0,0)
- (1,0,1)
- (2,0,3)
- (3,0,0)
- (4,0,0)
- (5,0,0)
- (0,1,0)
- (1,1,2)
- ...
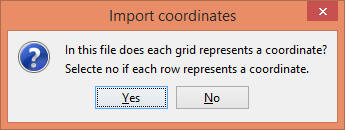
When importing the above csv file the program will prompt you whether each grid or each row represent a coordinate. Click Yes to select each grid.
Download 3D Graphing Calculator
You can purchase 3D Graphing Calculator if you haven't done so already and try importing your own csv files.
