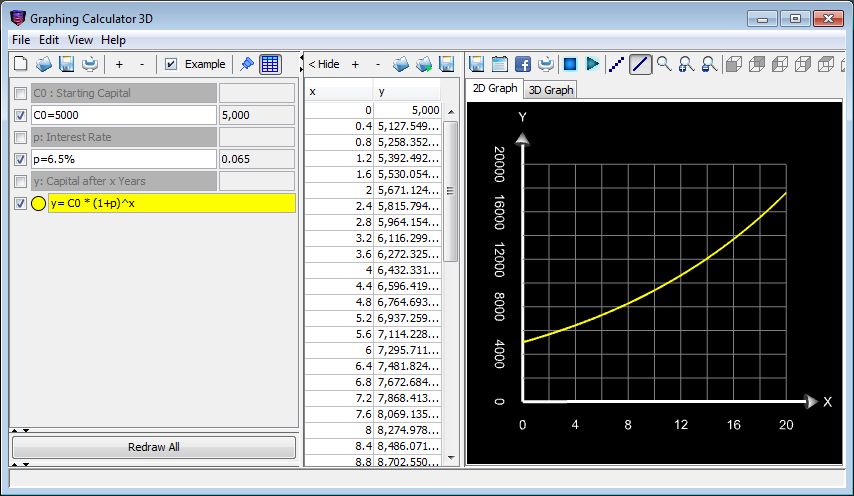
You can define your own variables and use them in graph equations. As soon as you change the value of a variable, its corresponding graph will be automatically recalculated and redrawn. To define a variable follow these steps:
The value of variables are not limited to simple numbers. They can evaluate any math expressions or even depend on other variables. For example you could define the following variables:
a=0.5
b=2.25
c=a+b
Then you can plot an equation that depends on c. In this situation if the value of a, b, or c changes, then the graph will be automatically recalculated and redrawn.
Hint: You may also use the definition of a variable for inserting a comment. Just set the graph type to "None". Then write a comment and unselect the line. The comment line is highlighted in gray, the error message can be ignored.

Copyright (c) 2000-2018 - Runiter Company - support@runiter.com