|
 Are you taking a beginner statistics course and
need help in learning statistics and solving your statistics homework? This
is statistics tutorial software
that can solve statistical problems and generate step-by-step solutions. Are you taking a beginner statistics course and
need help in learning statistics and solving your statistics homework? This
is statistics tutorial software
that can solve statistical problems and generate step-by-step solutions.
Statistics
Tutorial...
Statistics help is only a few clicks away. This
amazing computer program not only solves your statistical problems for you,
but it also shows you how to solve them by demonstrating the various steps
and formulas that are involved in solving those problems.
Easy to get Statistics Help...
 Getting statistics help
to learn more about statistical distributions or to do your statistics
homework is easy. Simply select one of the available statistical
distributions from the main menu (i.e. continuous
distribution). Then fill in the blanks with data given by the
problem statement that you are trying to solve. Finally press Solve
and observe the step-by-step solution that is generated for you. Getting statistics help
to learn more about statistical distributions or to do your statistics
homework is easy. Simply select one of the available statistical
distributions from the main menu (i.e. continuous
distribution). Then fill in the blanks with data given by the
problem statement that you are trying to solve. Finally press Solve
and observe the step-by-step solution that is generated for you.
Statistics tutorial for
beginners...
 This software is intended to be a
statistics help for university
and college students who are taking beginner statistics courses. Statistic Problem
Solver is designed based on University of Ottawa Statistics & Probability (MAT2377)
course. The solution algorithms are based on those introduced in the "Statistical Methods for Engineers" book by G. Geoffrey Vining,
Duxbury, 1998, and also the lecture notes of professor D. McDonald's. This software is intended to be a
statistics help for university
and college students who are taking beginner statistics courses. Statistic Problem
Solver is designed based on University of Ottawa Statistics & Probability (MAT2377)
course. The solution algorithms are based on those introduced in the "Statistical Methods for Engineers" book by G. Geoffrey Vining,
Duxbury, 1998, and also the lecture notes of professor D. McDonald's.
Key Features
The current version of Statistics
Problem Solver can solve and generate the following
statistical analysis:
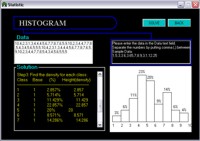
-
Plotting Histograms: The histogram generator inputs numbers as data
and draws a histogram based on the given data.
-
Discrete Distributions: Two types of distributions can be
analyzed here:
-
Binomial Distribution
-
Poisson Distribution
-
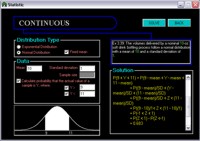
Continuous distributions: Continuous distributions can be solved here
based on one of the following distributions:
-
Exponential Distribution
-
Normal Distribution
-
Test of Significance: Test your hypotheses using the significance test
analyzer and figure out whether the mean of a give information is what you
expected.
-
Data Comparison: Compare two groups of statistical data in order to test
your hypothesis of the differences between the groups.
|
60-day Money Back Guarantee: We
care about your satisfaction and for that, all our products are subject
to a 60-day money back guarantee. If for any reason you were not
satisfied with a purchased product, we will refund you within 24 hours
of receiving your refund request. For refund, email us at
support@runiter.com with your
name and order id. |
See our other products:
|